Day 12
Math 216: Statistical Thinking
Bastola
The Normal Distribution
The Normal Distribution is a continuous probability distribution that is symmetrical around its mean, represented by \(\mu\). This distribution is crucial in statistics and is often used to represent real-world variables.
\[ f(x)=\frac{1}{\sigma \sqrt{2 \pi}} \exp \left(-\frac{1}{2}\left(\frac{x-\mu}{\sigma}\right)^2\right) \]
- \(\mu=\) Mean (center of the bell)
- \(\sigma=\) Standard deviation (width of the bell)
- \(\pi \approx 3.14159\), \(e \approx 2.71828\)
Key Insight: The formula looks complex, but it just describes a perfectly balanced bell curve!
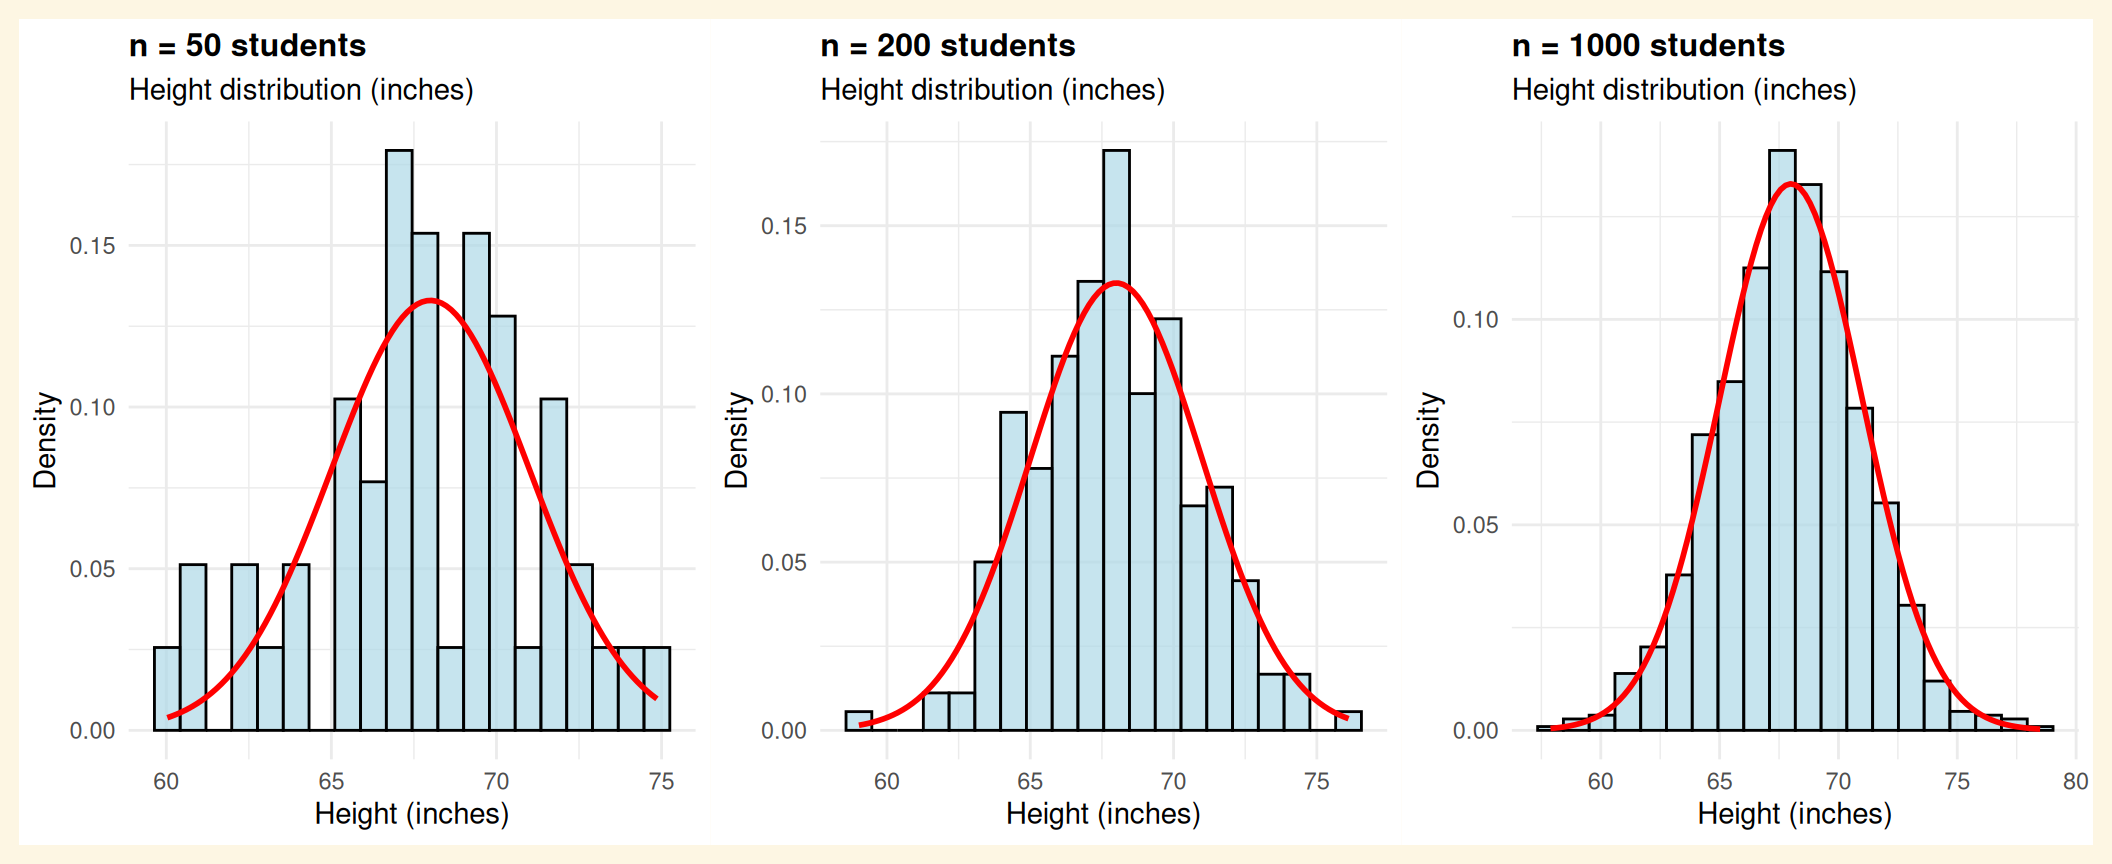
Visualizing the Bell Curve
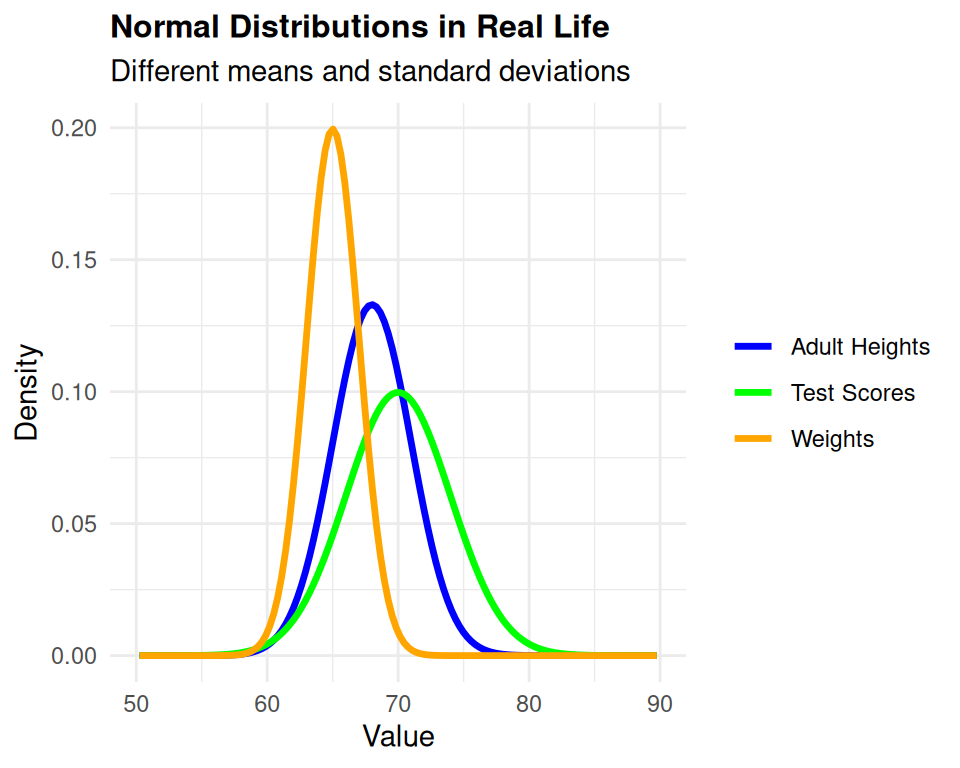
Real-World Applications: Where Normality Appears
Everyday Examples:
- Human heights - cluster around average with few very tall/short people
- Test scores - most students score near the middle
- Measurement errors - equally likely to be positive or negative
- Daily temperatures - vary around seasonal averages
The Standard Normal Distribution: Our Universal Tool
A special case where \(\mu=0\) and \(\sigma=1\). This is our universal translator for all normal distributions!
\[ f(z)=\frac{1}{\sqrt{2 \pi}} \exp \left(-\frac{1}{2} z^2\right) \]
Why it’s amazing:
- Every normal problem becomes a standard normal problem
- We can use Z-tables or software functions
- It’s like having one key that opens every lock!
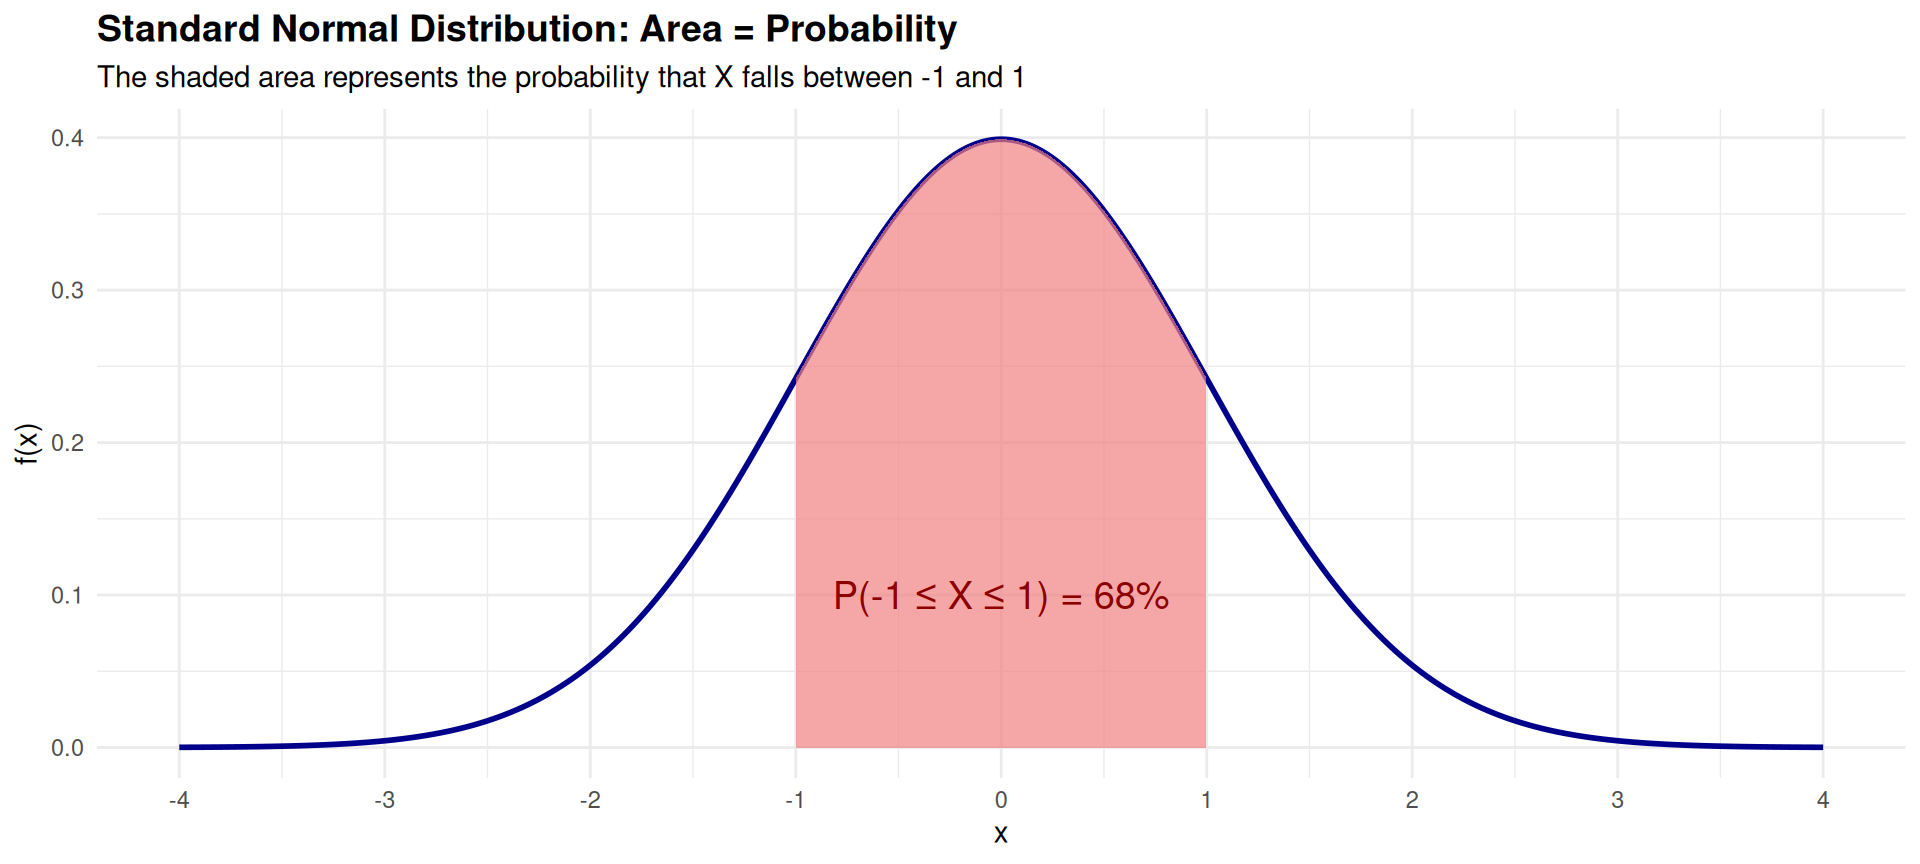
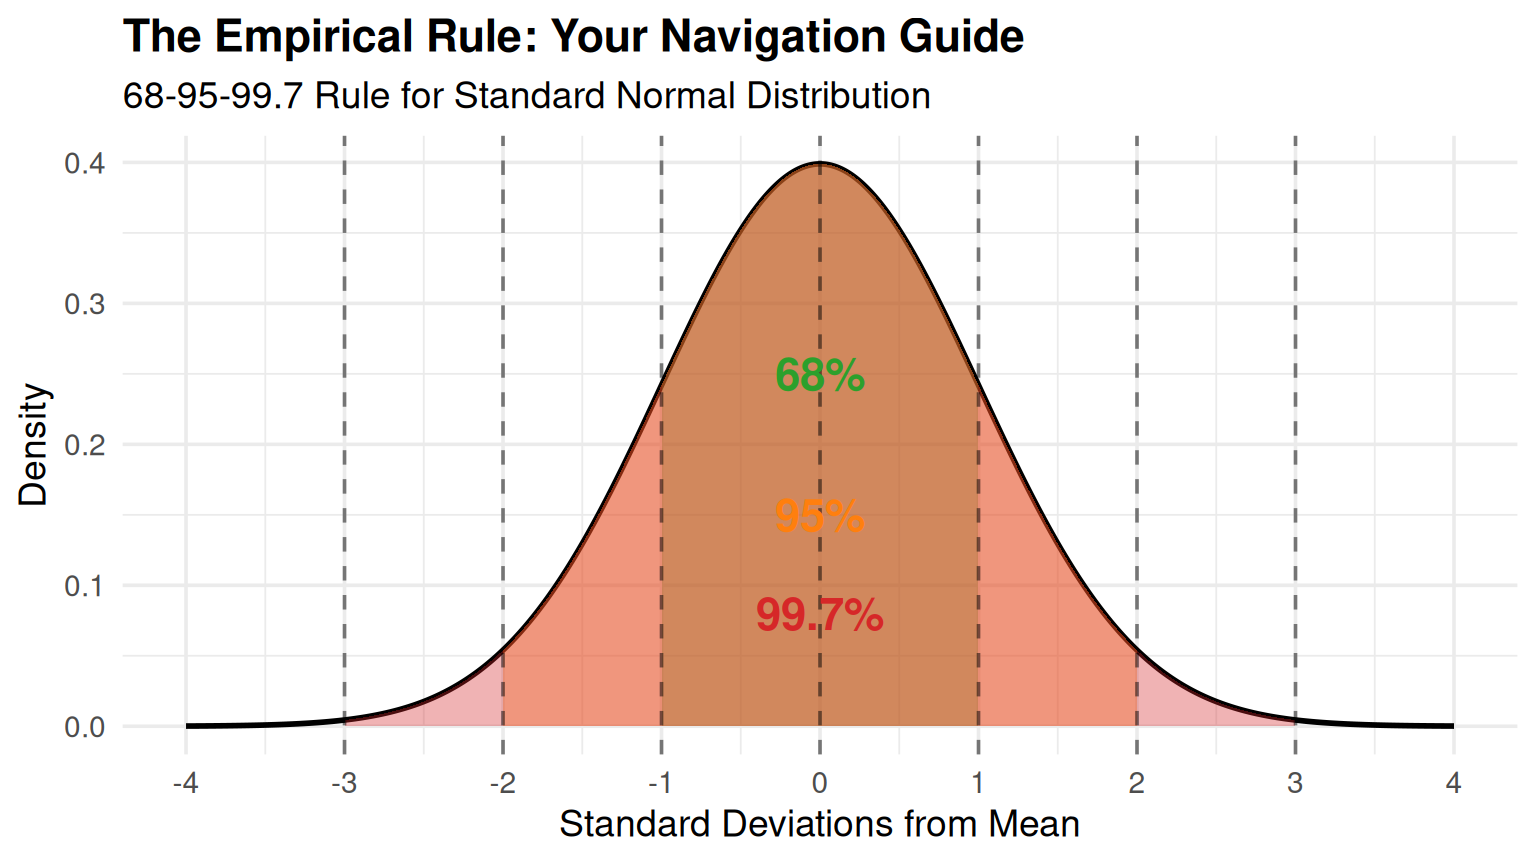
Area = Probability: A Visual Journey
The Empirical Rule
Converting Normal Variable to Standard Normal
To utilize the standard normal distribution effectively in statistical calculations, we convert a normal random variable \(x\) with any mean \(\mu\) and standard deviation \(\sigma\) to a standard normal variable \(z\).
Z-score
\[ Z = \frac{x - \mu}{\sigma} \]
Example:
To find the probability of \(x\) being less than a particular value \(x_0\), use: \[ P(x \leq x_0) = P\left(Z \leq \frac{x_0 - \mu}{\sigma}\right) \]
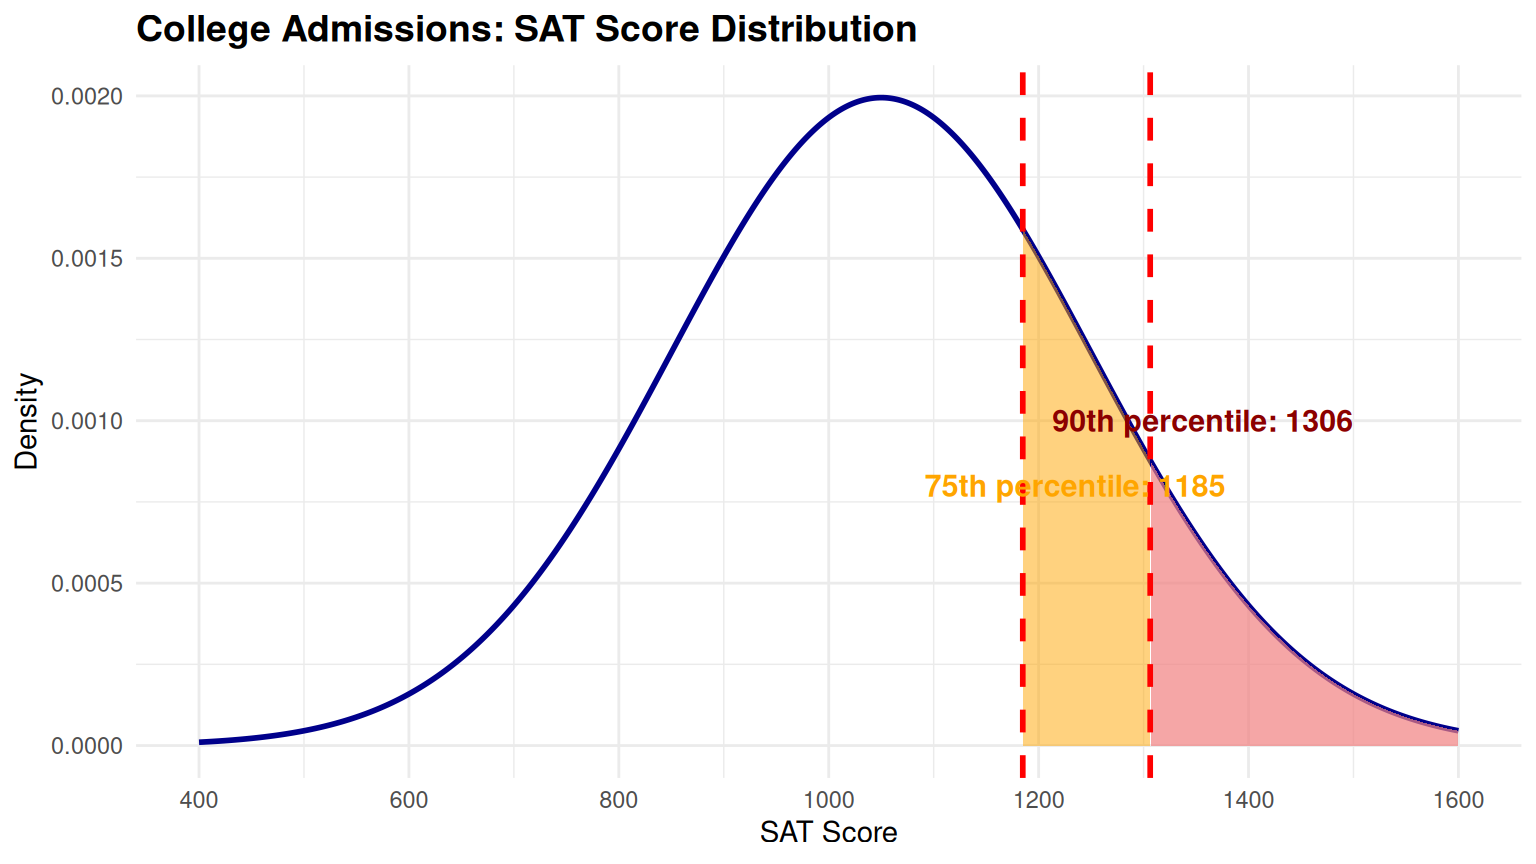
College Admissions Analysis
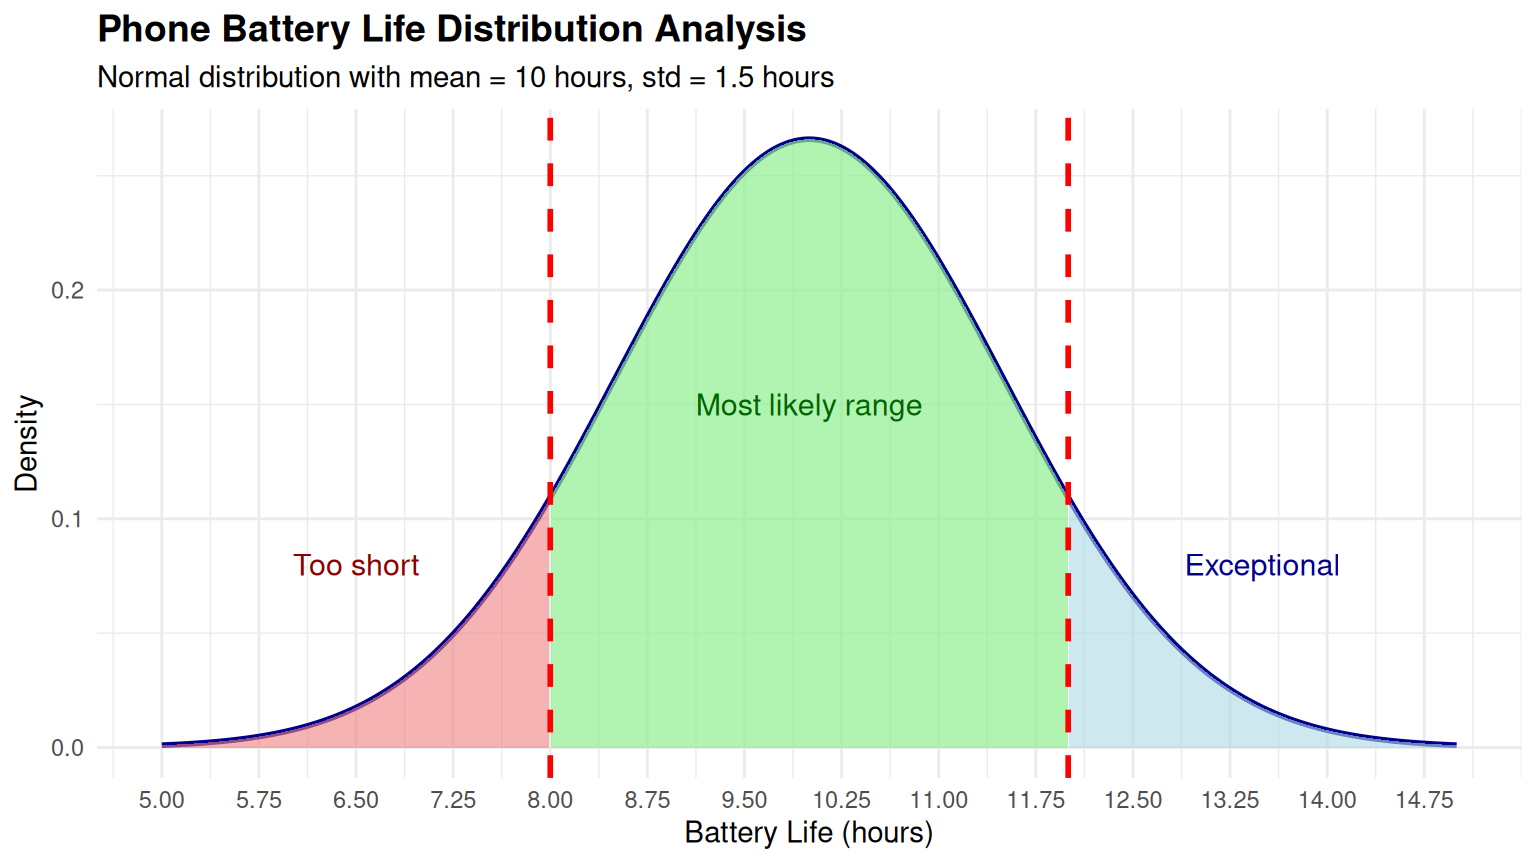
Phone Battery Life Analysis
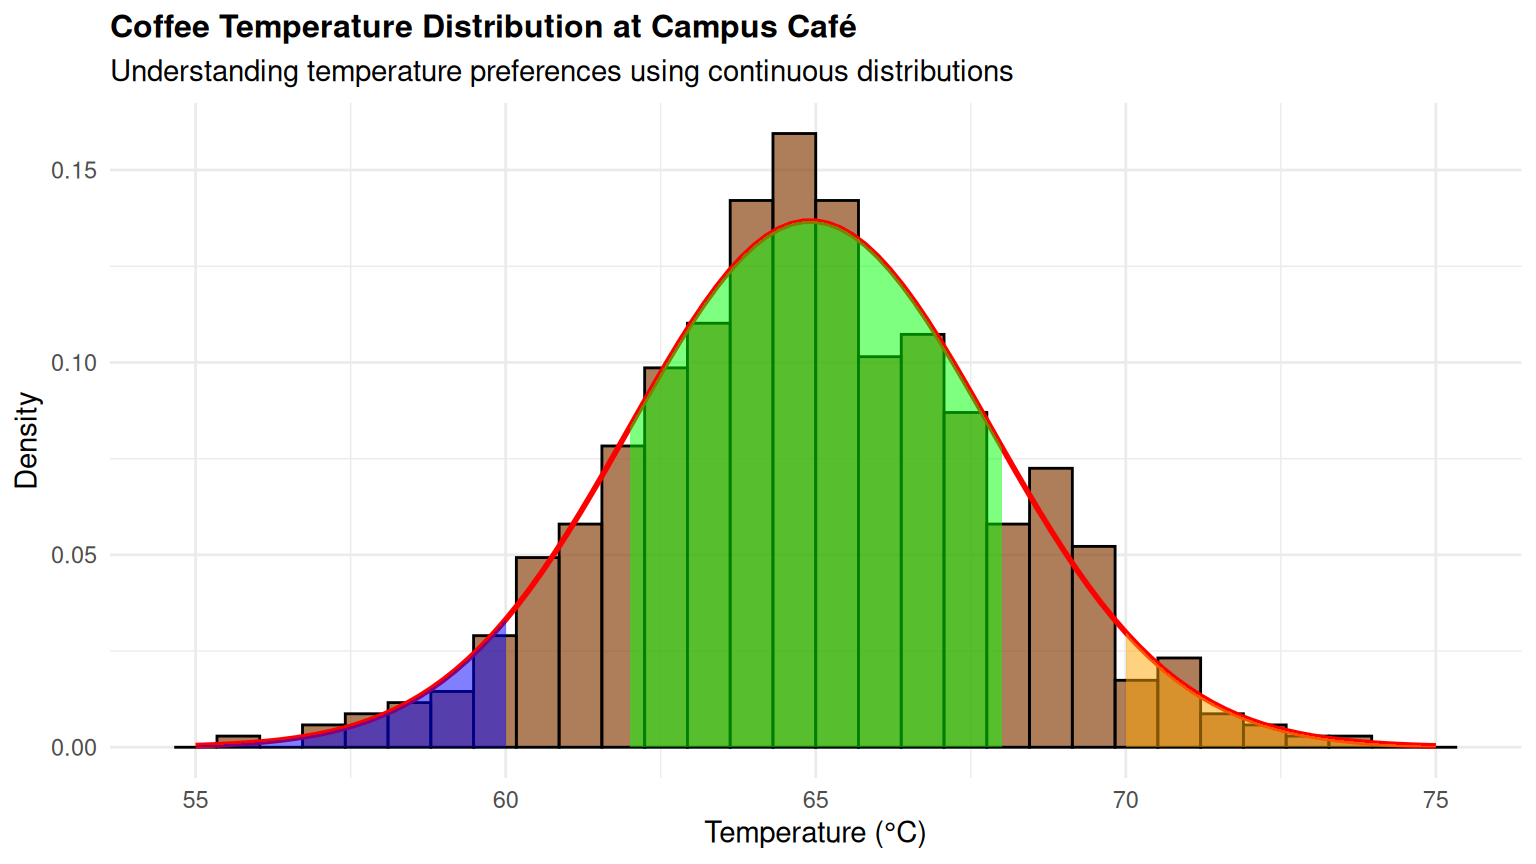
Case Study: Coffee Temperature Analysis