Day 2
Math 216: Statistical Thinking
Sampling and Inference
- A population includes all individuals or objects of interest.
- A sample is all the cases that we have collected data on (a subset of the population).
- Statistical inference is the process of using data from a sample to gain information about the population.
Sampling and Inference (Source)
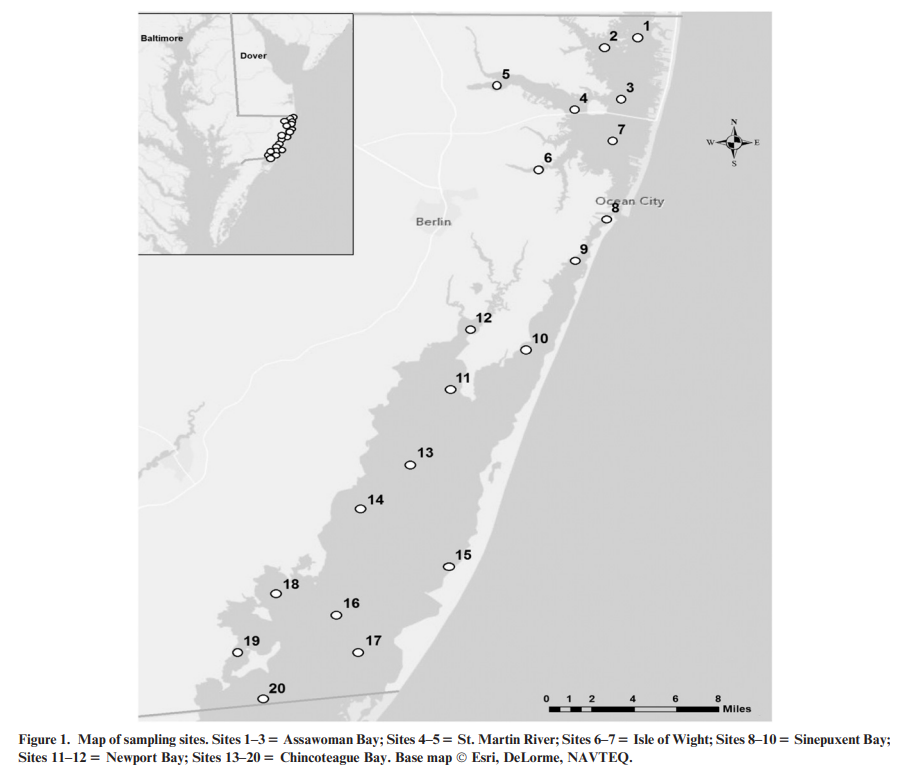
Blue Crab in Maryland Coastal Bays
Population
- All blue crabs in the Maryland Coastal Bays (MCB).
- Includes sub-estuaries: Assawoman Bay, St. Martin River, Isle of Wight, Sinepuxent Bay, Newport Bay, Chincoteague Bay.
Sample
- Blue crabs collected from 20 sites within MCB.
- Sample period: April - December, 2014-2016.
- Method: Trawl surveys.
Blue Crab in Maryland Coastal Bays
Variables
- Primary Variable: Carapace width, sex, maturity status, molt stage.
Inference
- Population structure of blue crabs in MCB.
- Seasonal variations: size distribution, molt cycles, reproductive patterns.
Sampling Bias
- Sampling bias occurs when the method of selecting a sample causes the sample to differ from the population in some relevant way.
- If sampling bias exists, we cannot trust generalizations from the sample to the population.
To eliminate sampling bias, always take a RANDOM SAMPLE!
Bias in Data
Even with a random sample, data can still be biased, especially when collected on humans.
Some forms of bias to watch out for in data collection:
- Question wording.
- Question order.
- Context.
- Non-response bias.
Question Wording
A random sample was asked: “Should there be a tax cut, or should money be used to fund new government programs?”
| Tax Cut | Programs |
|---|---|
| 60% | 40% |
Question Wording
A different random sample was asked: “Should there be a tax cut, or should money be spent on programs for education, the environment, health care, crime-fighting, and military defense?”
| Tax Cut | Programs |
|---|---|
| 22% | 78% |
Context
Ann Landers column asked readers “If you had it to do over again, would you have children?”
The first request for data contained a letter from a young couple which listed worries about parenting and various reasons not to have kids.
\[30\% \text{ said yes}\]
The second request for data was in response to this number, in which Ann wrote how she was “stunned, disturbed, and just plain flummoxed.”
\[95\% \text{ said yes}\]
Non-response Bias
When respondents are either unable or unwilling to respond to your survey, this results in non-response bias.
- Survey targeted to the wrong audience.
- There is general unwillingness due to polar opposite opinions.
- The survey did not reach the right respondent.
- e.g., A survey asking teenagers about the best cigarette brands.
Experiment vs. Observational Study
An observational study is a study in which the researcher does not actively control the value of any variable but simply observes the values as they naturally exist.
An experiment is a study in which the researcher actively controls one or more of the explanatory variables.