Day 22
Math 216: Statistical Thinking
Introduction to Hypothesis Testing: Statistical Decision Framework
Key Question: How can we make objective decisions about population parameters using sample evidence? Hypothesis testing provides the mathematical framework for evaluating claims with quantified uncertainty!
Real-World Applications:
- Quality Control: Verify manufacturing standards compliance
- Medical Research: Test treatment effectiveness in clinical trials
- Market Research: Evaluate consumer preference claims
- Environmental Science: Assess regulatory compliance
- Public Policy: Evaluate program effectiveness
Elements of a Test of Hypothesis
Real-World Case Study: Quality Control
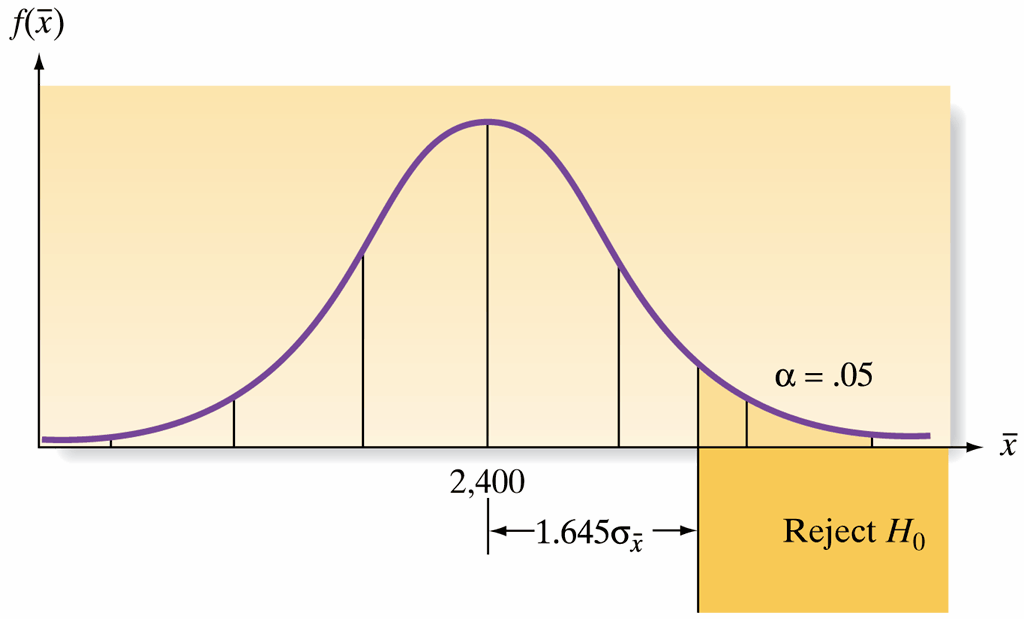
Context: City regulations require residential sewer pipes to have an average breaking strength greater than 2,400 pounds per foot. Manufacturers must demonstrate that their products meet this standard.
Statistical Framework:
- Null Hypothesis (\(H_0\)): \(\mu \leq 2400\) (Pipes do not meet standard)
- Interpretation: Assume pipes are inadequate until proven otherwise
- Analogy: “Innocent until proven guilty”
- Alternative Hypothesis (\(H_a\)): \(\mu > 2400\) (Pipes meet or exceed standard)
- Interpretation: What we want to demonstrate
- Burden of Proof: Evidence must strongly support this claim
Key Insight: The null hypothesis represents the “status quo” or default position that requires strong evidence to overturn!
Testing the Hypothesis
Test Statistic Calculation
Central Limit Theorem Foundation: For large samples (\(n \geq 30\)), \(\bar{x}\) approximates a normal distribution, enabling standardized test statistics.
Test Statistic Formula: \[ z = \frac{\bar{x} - \mu_0}{\sigma/\sqrt{n}} \]
Components:
- \(\bar{x}\): Sample mean from data
- \(\mu_0\): Hypothesized population mean (2400)
- \(\sigma\): Population standard deviation
- \(n\): Sample size
Interpretation: The z-score measures how many standard errors the sample mean is from the hypothesized value!
Decision Making Framework
Statistical Decision Criteria
Critical Value Approach:
- If the observed \(\bar{x}\) exceeds 1.645 standard deviations above 2,400, we consider rejecting \(H_0\)
- This corresponds to a 5% significance level (\(\alpha = 0.05\))
Statistical Reasoning:
- Rejection implies that a rare event (occurring with probability \(\leq 0.05\) under \(H_0\)) is unlikely without true cause
- If such an extreme result occurs, it provides evidence that \(H_a\) is likely true
Key Principle: We only reject \(H_0\) when the evidence is sufficiently strong to overcome the presumption of innocence!
Evidence from Sample Data
Practical Application: Pipe Strength Analysis
Sample Characteristics:
- Number of samples (\(n\)): 50
- Mean strength (\(\bar{x}\)): 2,460 pounds per linear foot
- Standard deviation (\(s\)): 200 pounds per linear foot
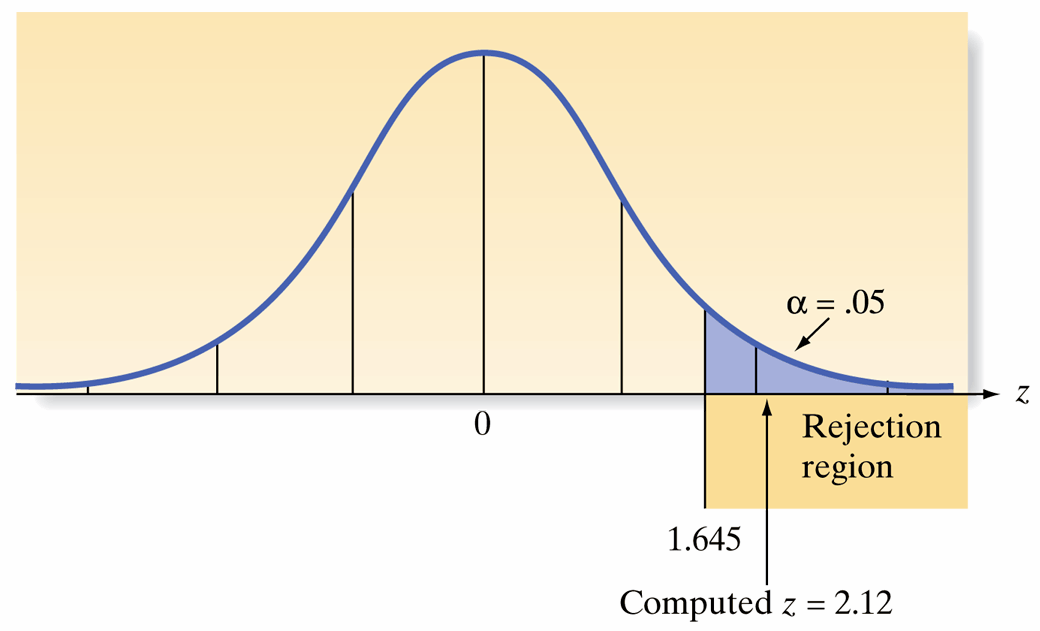
Test Statistic Calculation: \[ z = \frac{\bar{x} - 2400}{s/\sqrt{n}} \approx \frac{2460 - 2400}{200 / \sqrt{50}} = \frac{60}{28.28} \approx 2.12 \]
Statistical Interpretation:
- The sample mean is 2.12 standard errors above the hypothesized value
- This exceeds the critical value of 1.645 for \(\alpha = 0.05\)
- Conclusion: Strong evidence to reject \(H_0\) and conclude pipes meet the standard
Types of Errors
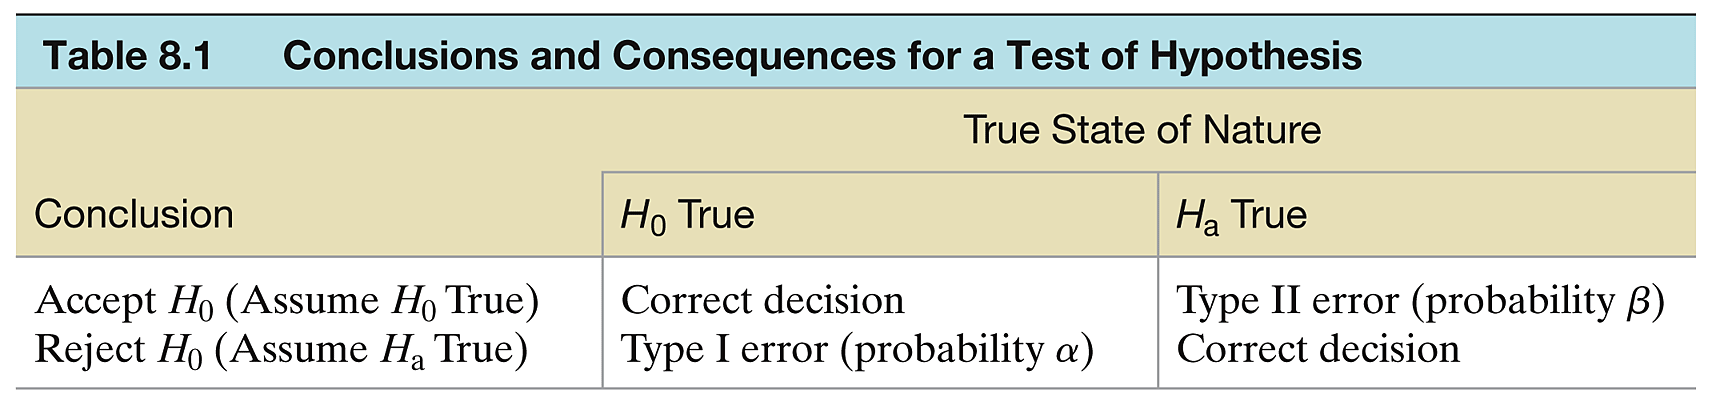
Type I Error
- Analogy: Convicting an innocent person.
- Occurs if we reject \(H_0\) when it is, in fact, true.
- Probability of Type I error is denoted by \(\alpha\) (commonly set at 0.05).
Types of Errors
Type II Error
- Analogy: Acquitting a guilty person.
- Occurs if we fail to reject \(H_0\) when, in fact, \(H_a\) is true.
- Probability of Type II error is denoted by \(\beta\).
- Unlike \(\alpha\), \(\beta\) is not usually pre-specified but affected by the sample size, effect size, and the set \(\alpha\).
Types of Errors
Key Statistical Principles
Essential Hypothesis Testing Concepts:
- Presumption of Innocence: \(H_0\) represents the default position requiring strong evidence to overturn
- Burden of Proof: Evidence must be sufficiently strong to reject \(H_0\)
- Error Control: Balance Type I (\(\alpha\)) and Type II (\(\beta\)) errors
- Decision Framework: Use standardized test statistics and critical values
Statistical Guidelines:
- Significance Level: Choose \(\alpha\) appropriate for research context
- Test Statistic: Calculate standardized measure of evidence
- Decision Rule: Compare test statistic to critical value
- Interpretation: Focus on strength of evidence, not absolute certainty
Next Topic: Extending these principles to different types of hypothesis tests