Day 23
Math 216: Statistical Thinking
Understanding P-Values
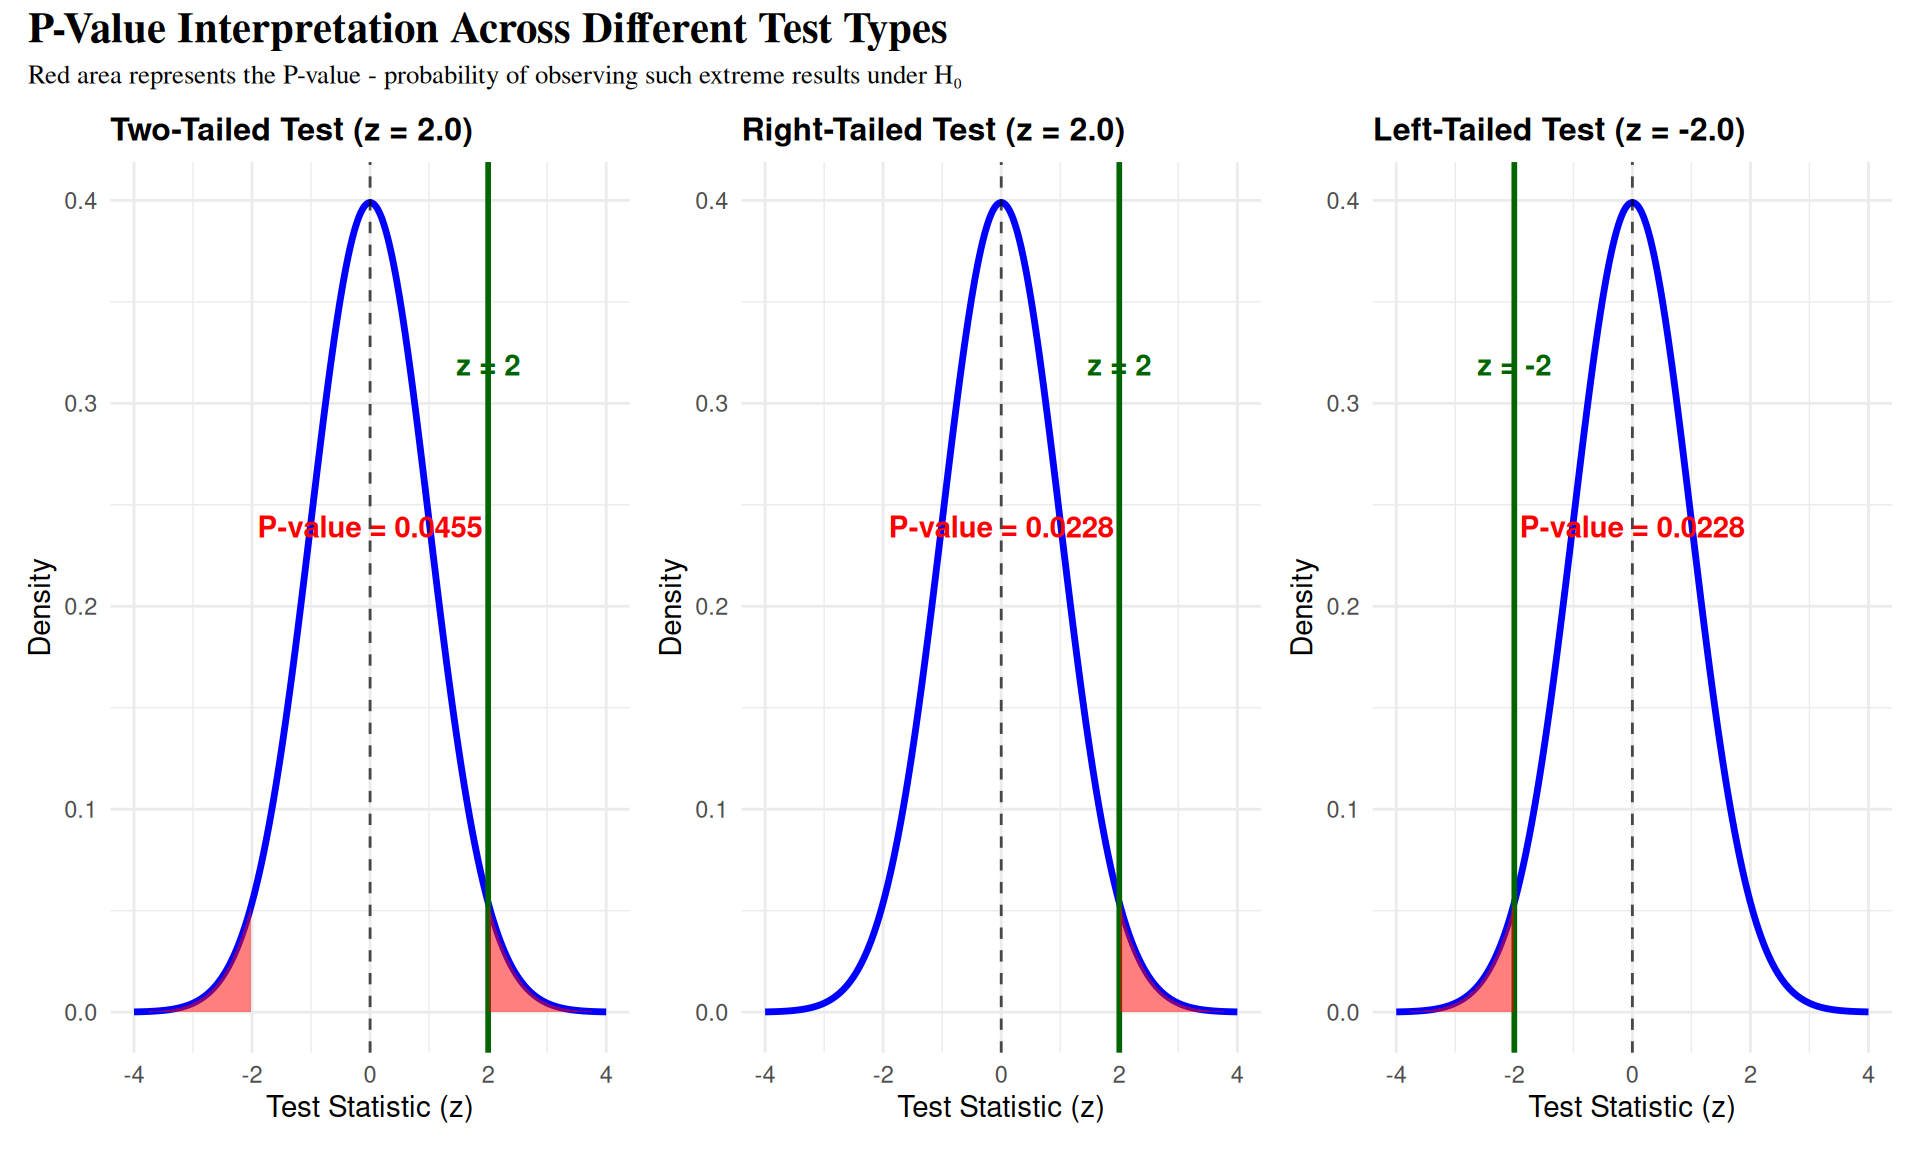
Case Study 1: Medical Research P-Value Interpretation
Context: Clinical trial testing new drug effectiveness with sample data showing z = 2.3
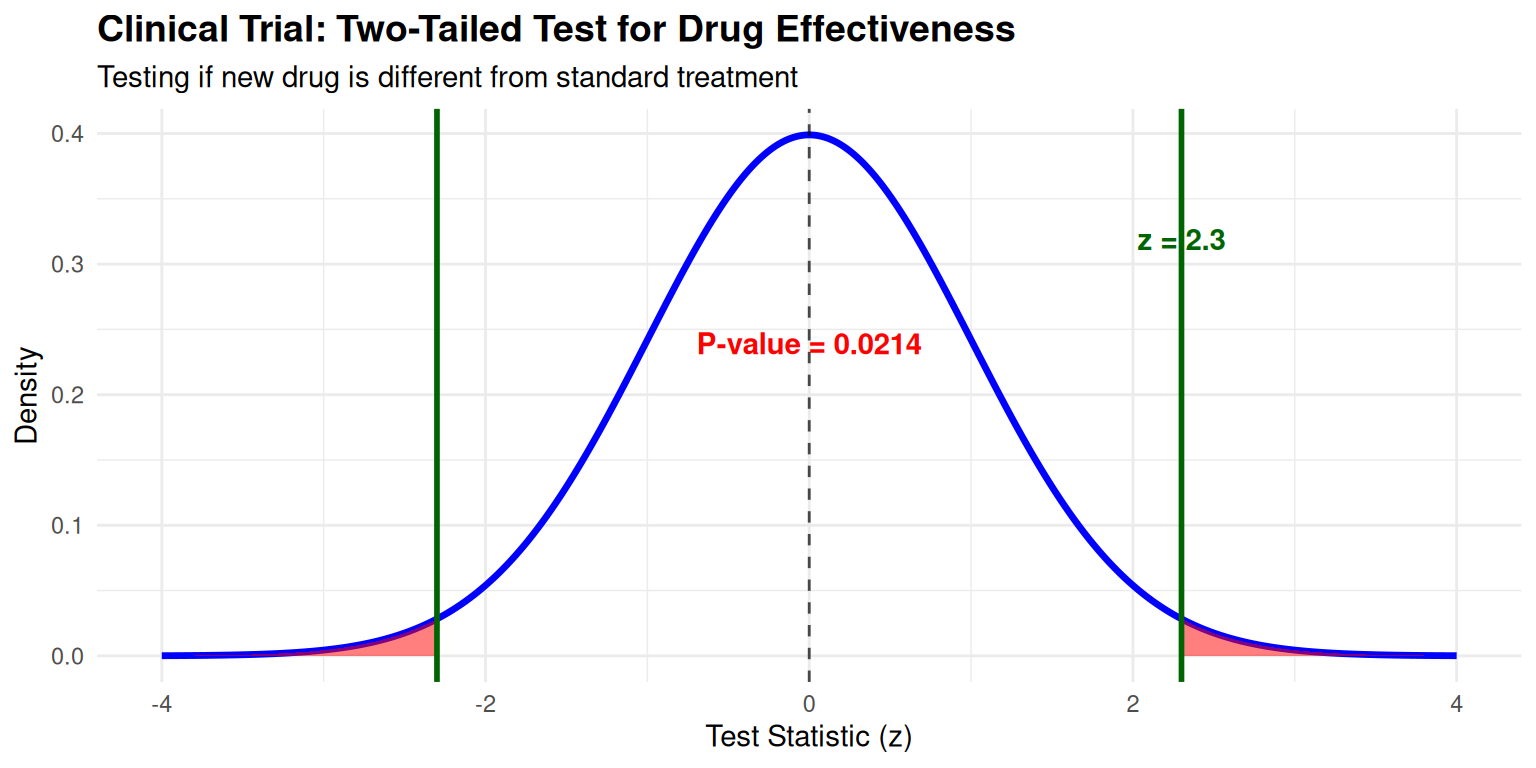
Statistical Analysis:
- P-value Calculation: \(p = 2 \times P(Z \geq |2.3|) = 2 \times (1 - P(Z \leq 2.3)) = 0.0214\)
- Interpretation: Strong evidence against null hypothesis (\(p < 0.05\))
- Conclusion: Statistically significant evidence that the new drug differs from standard treatment
Case Study 2: Quality Control P-Value Application
Context: Manufacturing process improvement testing with z = -2.8
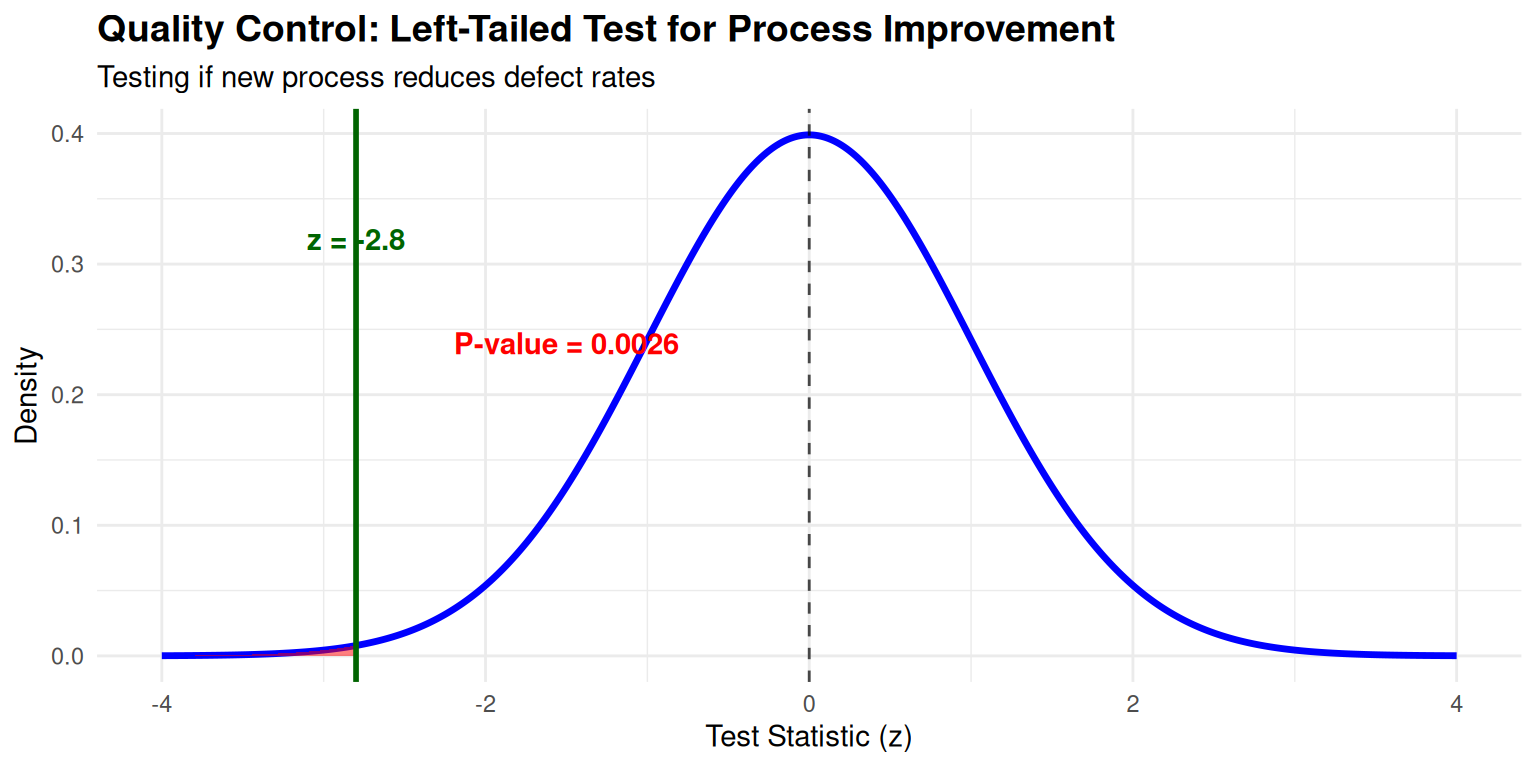
Statistical Analysis:
- P-value Calculation: \(p = P(Z \leq -2.8) = 0.0026\)
- Interpretation: Very strong evidence against null hypothesis (\(p < 0.01\))
- Conclusion: Highly significant evidence that the new process reduces defect rates