Call:
lm(formula = gpa ~ hours, data = gpa_data)

Residuals:
     Min       1Q   Median       3Q      Max
-0.32901 -0.17599  0.01954  0.17030  0.51221

Coefficients:
            Estimate Std. Error t value Pr(>|t|)
(Intercept) 2.258467   0.133749  16.886 1.75e-12 ***
hours       0.055878   0.006049   9.237 2.99e-08 ***
---
Signif. codes:  0 '***' 0.001 '**' 0.01 '*' 0.05 '.' 0.1 ' ' 1

Residual standard error: 0.2401 on 18 degrees of freedom
Multiple R-squared:  0.8258,    Adjusted R-squared:  0.8161
F-statistic: 85.33 on 1 and 18 DF, p-value: 2.985e-08Day 38
Math 216: Statistical Thinking
Bastola
Coefficient of Correlation and Determination
Key Question: How do we measure how well our regression model actually explains the data?
- Coefficient of Correlation (\(r\)):
- Measures the strength of the linear relationship between \(x\) and \(y\)
- Coefficient of Determination (\(r^2\)):
- Represents the proportion of variability in \(y\) explained by the linear relationship with \(x\)
- Total variability (SST) is made up of
- Explained (SSR): how far the model’s predictions stray from the mean, and
- Unexplained (SSE): how far the actual points stray from the model’s predictions
Real-World Insight: \(r^2\) tells us what percentage of the variation in our outcome variable is “explained” by our predictor!
Total Variability (SST)
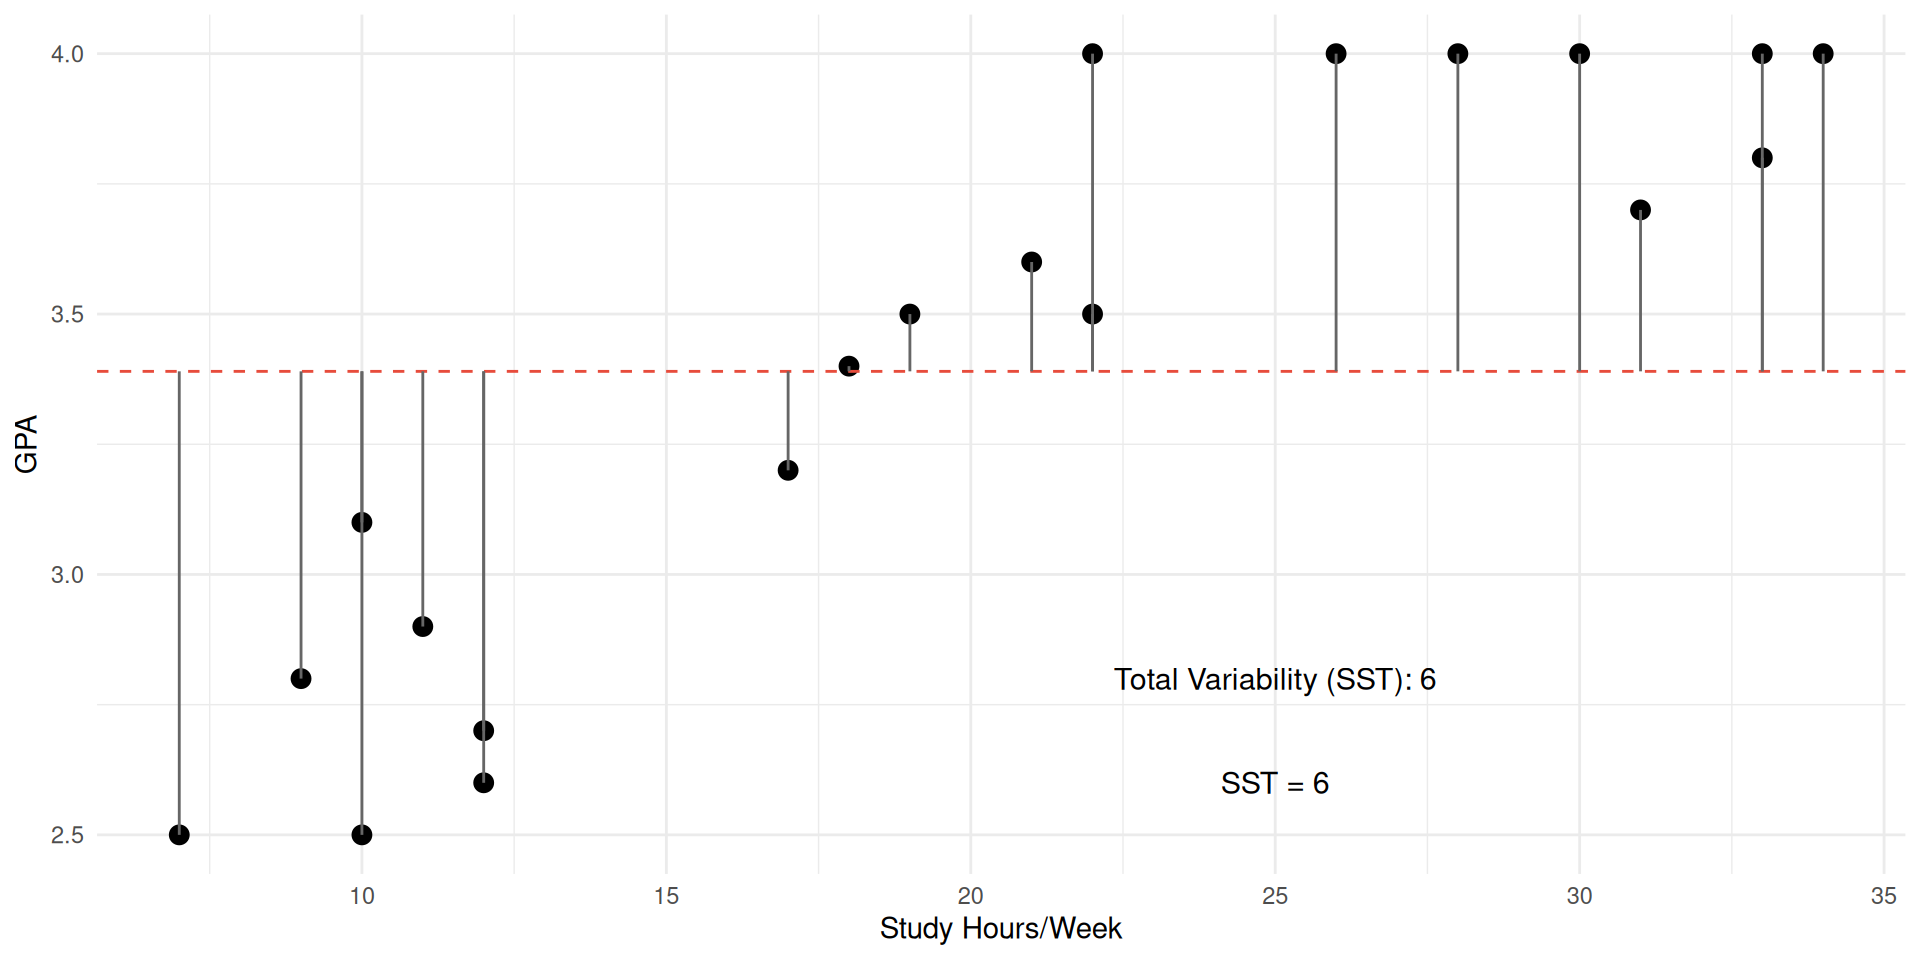
Total Variability (SST) in GPA
Explained Variability (SSR)
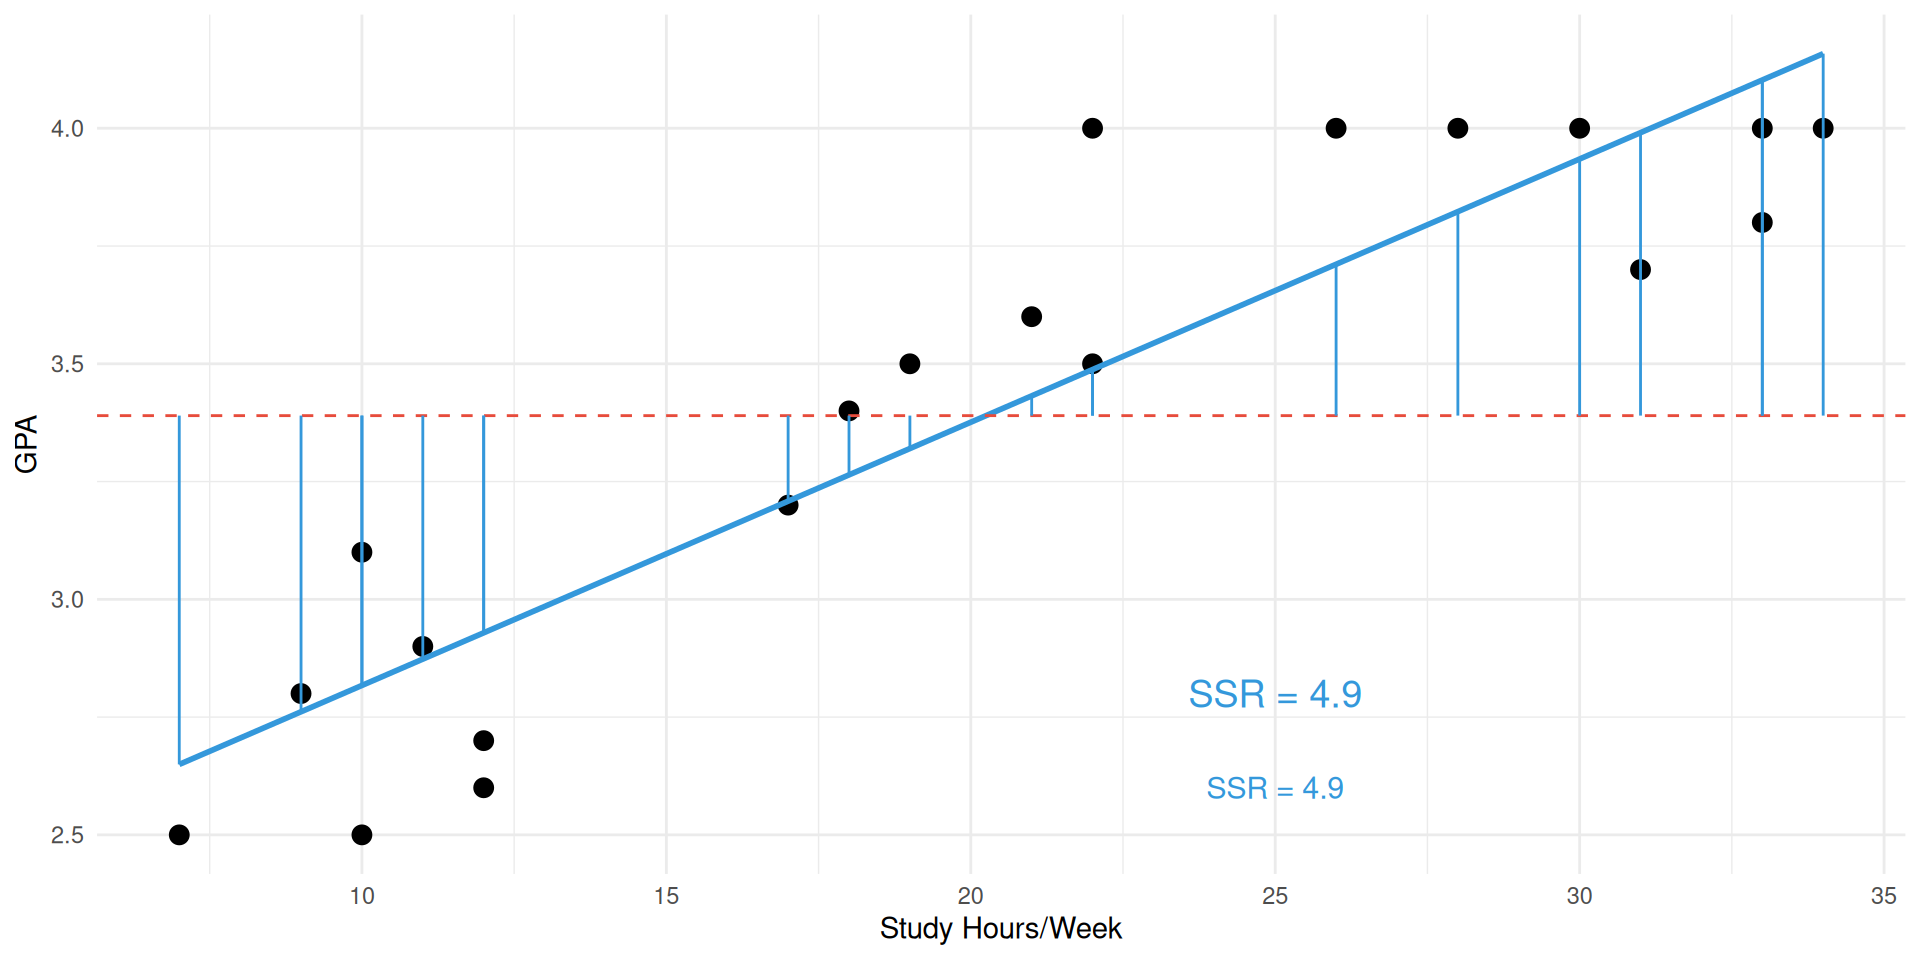
Explained Variability (SSR) with Regression
Unexplained Variability (SSE)
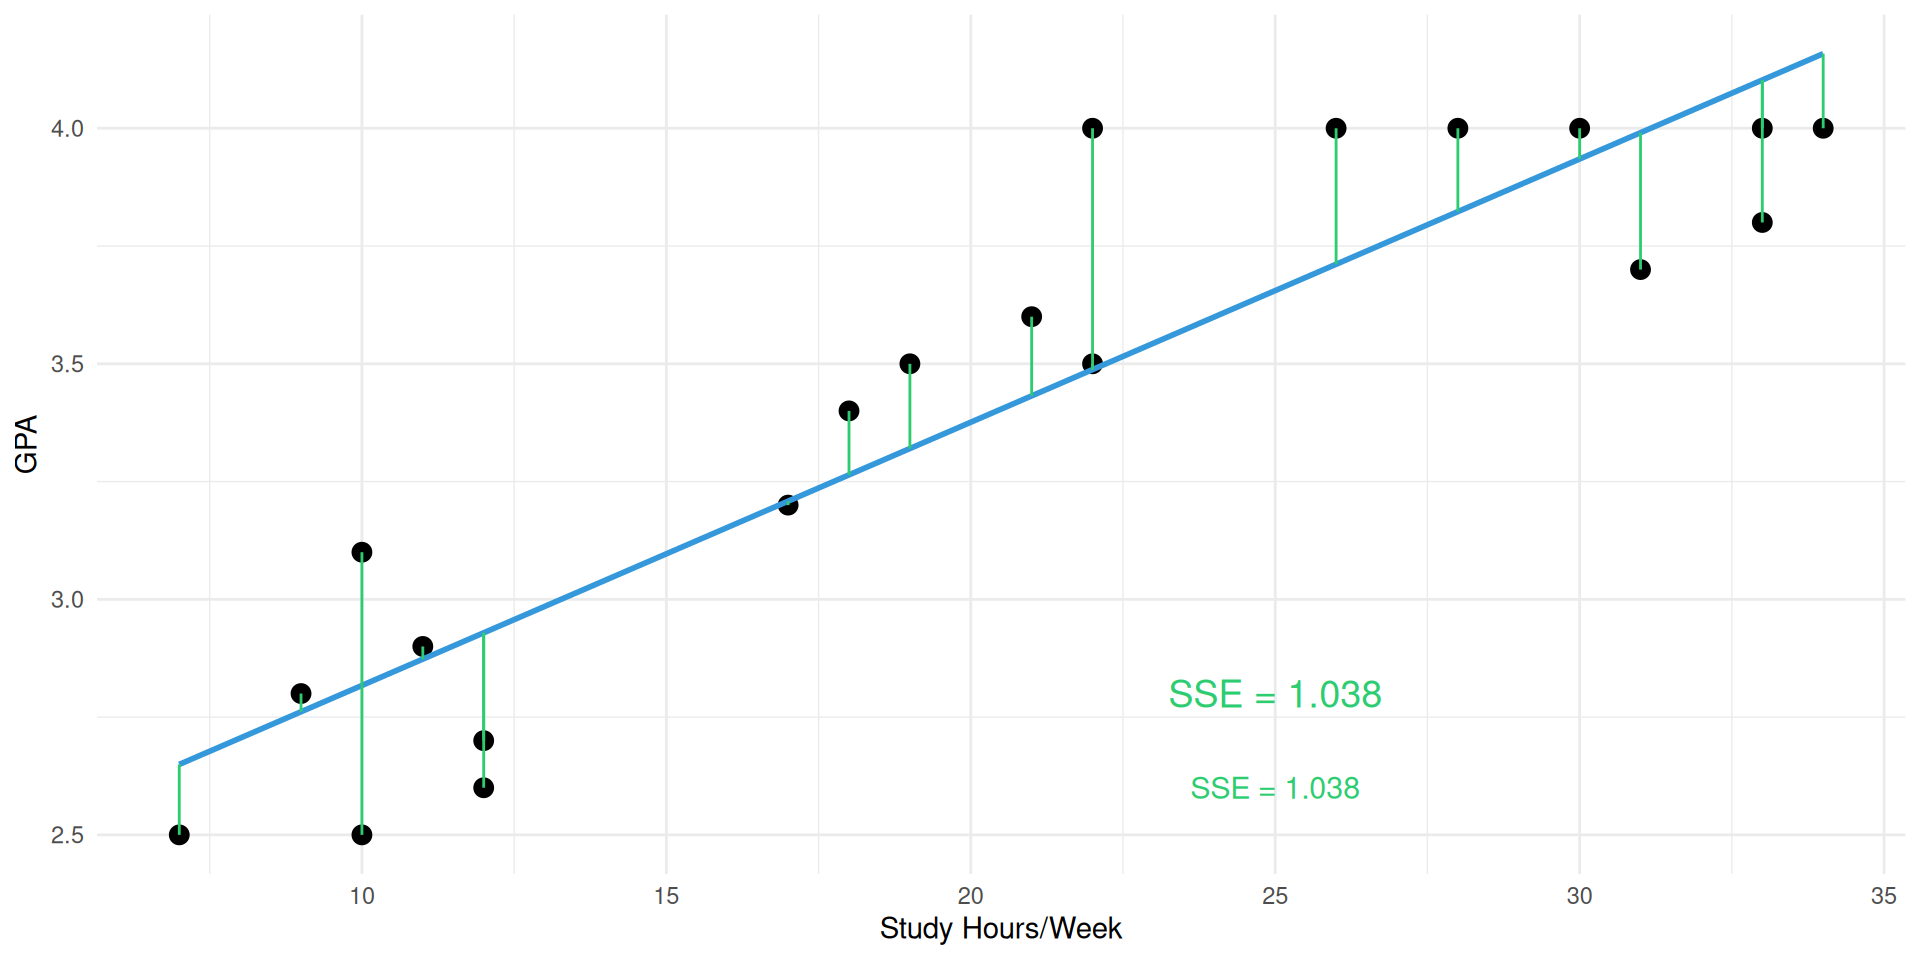
Unexplained Variability (SSE)
Coefficient Relationships
How do all these variability measures fit together mathematically?
Visual Guide:
- Red dashed line: Mean model (ȳ = 3.39)
- Blue line: Regression model (ŷ = 2.26 + 0.056x)
- Green segments: Unexplained variability (SSE = 1.038)
Mathematical Framework: \[ \begin{align} R^2 = \frac{\mathrm{SSR}}{\mathrm{SST}}=1-\frac{\mathrm{SSE}}{\mathrm{SST}} =\frac{\displaystyle\sum_i \bigl(\hat y_i - \bar y\bigr)^2}{\displaystyle\sum_i \bigl(y_i - \bar y\bigr)^2} = 1 - \frac{\displaystyle\sum_i \bigl(y_i - \hat y_i\bigr)^2}{\displaystyle\sum_i \bigl(y_i - \bar y\bigr)^2}. \end{align} \]
Calculations
Key Question: Let’s see the actual numbers - how much variation does study time really explain?
Formula Breakdown:
- SST = 5.958 (Total squared differences from mean)
- SSE = 1.038 (Unexplained squared errors)
- R² = 1 - 1.038/5.958 = 0.826
Practical Interpretation
Key Question: What does this R² value actually mean for real-world decision making?
Main Interpretation:
- With R² = 0.83, 83% of GPA variation associates with study hours
- Residual 17% influenced by other factors (course difficulty, prior knowledge)
Important Caveats:
- Explains associated variation, not necessarily causal
- Does not indicate prediction accuracy magnitude