set.seed(123)
whale_sightings <- rpois(52, lambda = 2.6)Activity 10
MATH 216: Statistical Thinking
Poisson Distribution Practice
Time Allocation: 15 minutes total
Part 1: Poisson Parameter Identification (5 minutes)
Blue Whale Research: Weekly sightings average = 2.6
Identify:
- \(\lambda\) (mean) = _________________________
- Theoretical \(\sigma\) = _____________________
Calculate Probabilities:
- \(P(\text{exactly 5 sightings})\) = _________________________
- \(P(\text{fewer than 2 sightings})\) = ______________________
Multiple Choice: Given \(\lambda = 4\), \(P(X=2)\) = ?
- □ 0.1465
- □ 0.1954
- □ 0.2381
- □ 0.2707
Part 2: Poisson Pattern Analysis (5 minutes)
Simulated Whale Data Summary:
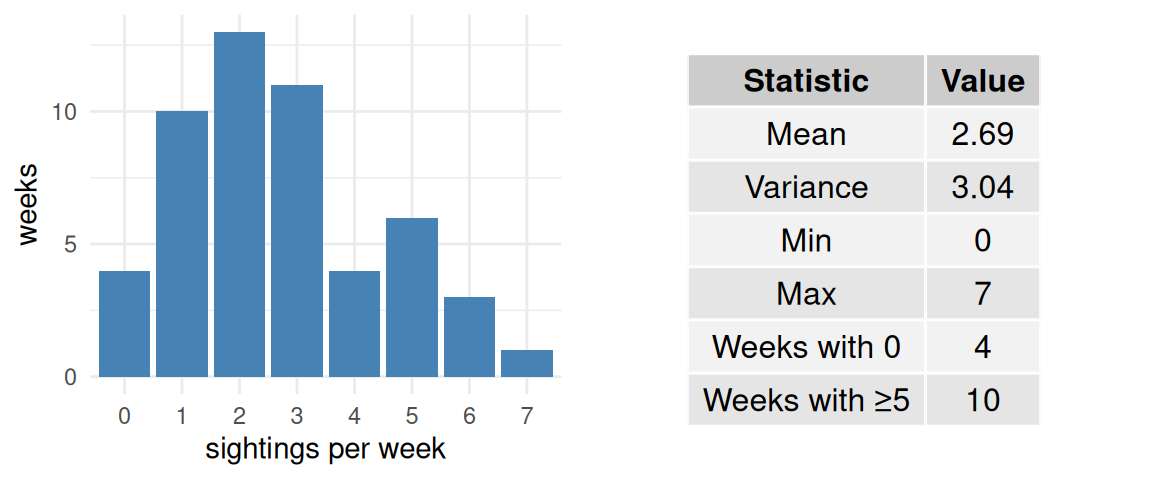
Analysis:
- Empirical mean vs theoretical λ: ___________________
- Variance/mean ratio: _____________________________
- Does data appear Poisson? □ Yes □ No
- Evidence: _______________________________________
Part 3: Traffic Safety Application (5 minutes)
Hypothetical Scenario: Monthly accidents at intersection - \(\lambda = 3\) accidents per month
Calculate:
- \(P(\text{exactly 5 accidents in month})\) = __________________
- \(P(\text{no accidents in month})\) = _______________________
- \(P(\text{more than 5 accidents in month})\) = ________________
Safety Planning:
- If \(P(>5 \text{ accidents}) > 0.05\), additional safety measures needed
- Recommendation: □ Implement measures □ No action needed
- Reasoning: _______________________________________